

Call logs
Call logs show what happened during voice calls in your account. Start with the Calls tab when you need to understand a call or diagnose a problem.
Vapi creates call records automatically. The assistant’s Logging setting controls detailed pipeline logs, while separate artifact settings control recordings and transcripts. See Retention and logging configuration for availability, storage, and compliance behavior.
To understand why a call ended, see Call ended reasons. This page is about reading the logs.
Access call logs
- Dashboard: Logs → Calls
- API: List calls and Get call
The calls list
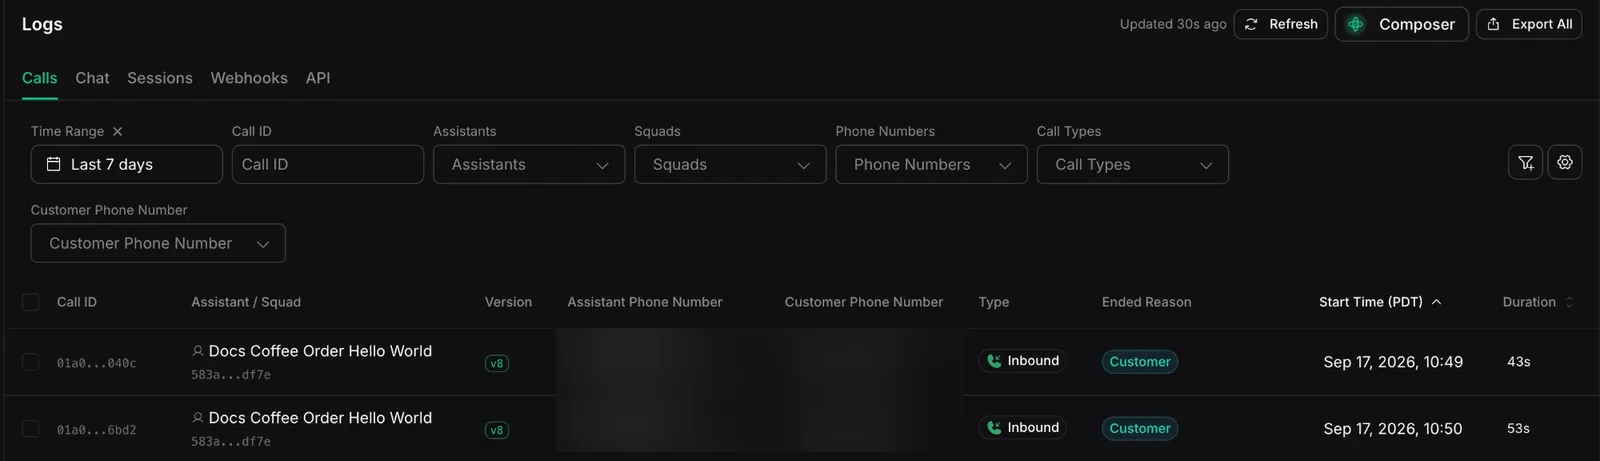
The Calls tab lists available calls, most recent first. Depending on your account and enabled features, each row can show:
- Call ID: the call’s unique identifier.
- Assistant / Squad: who handled the call.
- Version: the assistant or squad version.
- Assistant Phone Number: the Vapi or imported phone number used for the call.
- Customer Phone Number: the customer’s phone number.
- Type: the call type.
- Ended Reason: how the call finished.
- Start Time: when the call began.
- Duration: how long it lasted.
- Cost: what the call cost to run, when available.
Filter by time range, assistant, squad, phone number, call type, or a specific call ID.
The ended reason explains how each call finished. See Call ended reasons for what each code means and how to act on it.
Reading a single call
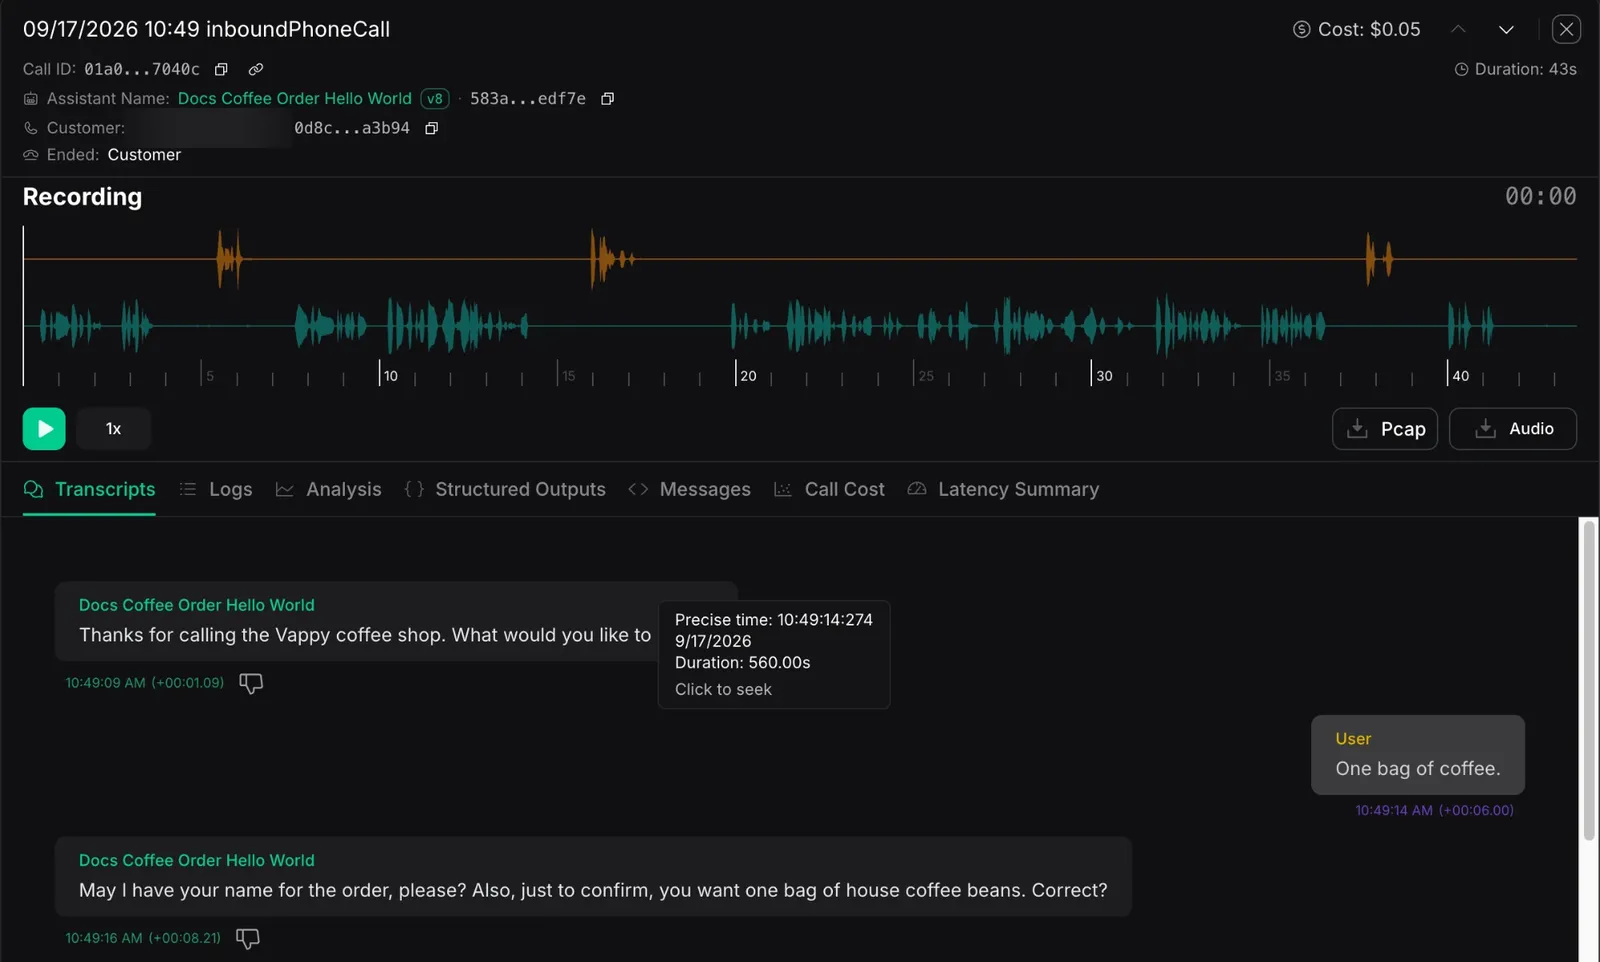
When a recording is available, the top of the page shows a waveform you can play and scrub. Depending on the call and its artifact settings, downloads can include mono, stereo, assistant-only, customer-only, video, or packet capture (PCAP) files. Below are the per-call tabs.
Transcripts
When a transcript is available, this tab shows the conversation as speaker-labeled bubbles. The assistant appears on one side and the caller on the other.
Each line shows the wall-clock time and its offset from the start of the call. Select a line to seek the recording to that moment. Tool calls can appear inline, and the tab marks the end of the call.
Logs
The assistant’s Logging setting controls detailed pipeline logging. When stored entries are available, this tab shows them in order. Each row includes the time, level, category, and message. Categories can include Transcriber, Model, Voice, Endpointing, Tool, Transport, Knowledge Base, Transfer, Webhook, System, Latency, Hook, and Chat.
Search and filter by level or category to narrow the list. You can also download the entries as gzipped JSON Lines (JSONL) from GET /call/{id}/call-logs. Clients must follow the 302 redirect.
Analysis
The Analysis tab can show:
- Summary: the model’s summary of the call.
- Success Evaluation: whether the call met the criteria you set, or a note that none applied.
- Data: the structured data extracted from the conversation.
- Metadata and Assistant Override Variable Values: the metadata and any override variable values that were in effect for the call.
Summary, success evaluation, and structured data appear when you configure the corresponding analysis. Metadata and assistant override variable values appear when they are present on the call.
Structured Outputs
This tab shows the values Vapi extracted from the conversation against your schema. It also identifies any structured outputs that Vapi skipped. See Structured outputs for how to define them.
Messages
This tab shows the stored conversation-message objects for the call, in order. An object can represent a user, bot, or system message, a tool call, or a tool result. Each row shows its type or role, a timestamp, a copy button, and the full stored object as JSON.
Use this tab to inspect the message data retained for the call. The objects are not necessarily the exact payloads sent to or returned by the model provider. The stored history depends on your artifact configuration.
Function and API Request tools
Use Messages to inspect a tool call and its result. Use the call’s Logs tab to inspect request and response details when the assistant’s Logging setting is enabled.
The Logs → API tab records requests made to the Vapi API. It does not show requests that an API Request tool sends to your destination.
For an async Function tool, Vapi returns an immediate Success. result to the assistant and ignores the webhook’s later result. Open Logs → Webhooks to inspect the webhook response after it finishes. Detailed entries in the call’s Logs tab depend on the assistant’s Logging setting. See Logs overview for retention and compliance limits.
Call Cost
When available, the Call Cost tab shows the call’s total cost, duration, and per-category breakdown. The tab may be hidden for organizations with invoiced billing. Contact your account team for cost details that reflect your agreement.
Toggle between Currency and Quantity to view costs or usage. If the selected call has no stored cost breakdown, the tab shows No Cost Breakdown Available.
Categories can include speech-to-text (STT), large language model (LLM), text-to-speech (TTS), Vapi Platform, Transport, analysis, voicemail detection, and knowledge base. Some categories also show usage details, including model tokens or voice characters. See Understanding cost for what drives each component and Vapi pricing for current rates.
Latency Summary
The Latency Summary tab shows where time was spent during the call. It includes the turn count, average turn latency, and a breakdown by stage. Stages include Transcriber, Endpointing, LLM, Voice, and transport in each direction.
Use the per-turn table to find which stage made the call feel slow. It shows each turn’s total and per-stage milliseconds. The values are averages and per-turn measurements, not percentiles.
For the full object behind these views, see the call object. Recordings and artifacts are also covered in Call recording and Retrieve call artifacts.
Debug with call logs
Reach for call logs when a call did not go as expected:
- The call ended unexpectedly. Start with the ended reason. Call ended reasons explains each code and the next step.
- The assistant said something wrong. Compare Transcripts with the stored message data under Messages.
- The call was slow. Use Latency Summary to find the slow component.
- The cost was higher than expected. When Call Cost is available, use it to see which component drove the cost.
Related
- Why a call ended: Call ended reasons
- The call object and endpoints: Get call, List calls
- Recordings and artifacts: Call recording, Retrieve call artifacts